Prices
Purchase prices and product history, start- and end-of-month prices in By month, purchasing performance checks with To review, and Excel/CSV export.
about 7 minUpdated October 14, 2026
The "Prices" section in the sidebar collects purchase prices from incoming invoices in iiko. For each product you can see what it costs now, how the price has changed, and which supplier is cheaper. The section only shows data: nothing goes to iiko from here.
Where the prices come from#
- From incoming invoices in iiko — both the ones sent from ReconDoc and the ones entered in iiko directly. Documents deleted in iiko are not counted.
- Refresh — automatic, roughly every six hours. Each time ReconDoc rereads the receipts for the last 14 days, so a backdated correction gets picked up too. The "Refresh" button starts a refresh right away. While it runs, the button reads "Updating…", and the list stays usable.
- First visit — "Collecting delivery history": ReconDoc reads the receipts for the past year. This usually takes a few minutes, and you can close the page.
- The price is per base unit of the product in iiko (kg, l, pcs), excluding VAT. The supplier's packaging is not taken into account: a 10 kg box shows as a price per kilogram.
The list only has products with at least one receipt. If iiko isn't connected, the section asks you to connect it in Settings.
Product list#
Search looks up the product name as it is written in the iiko catalog. The "Supplier" filter keeps the products this supplier has delivered at least once. To sort, click a column header; click it again to reverse the order.
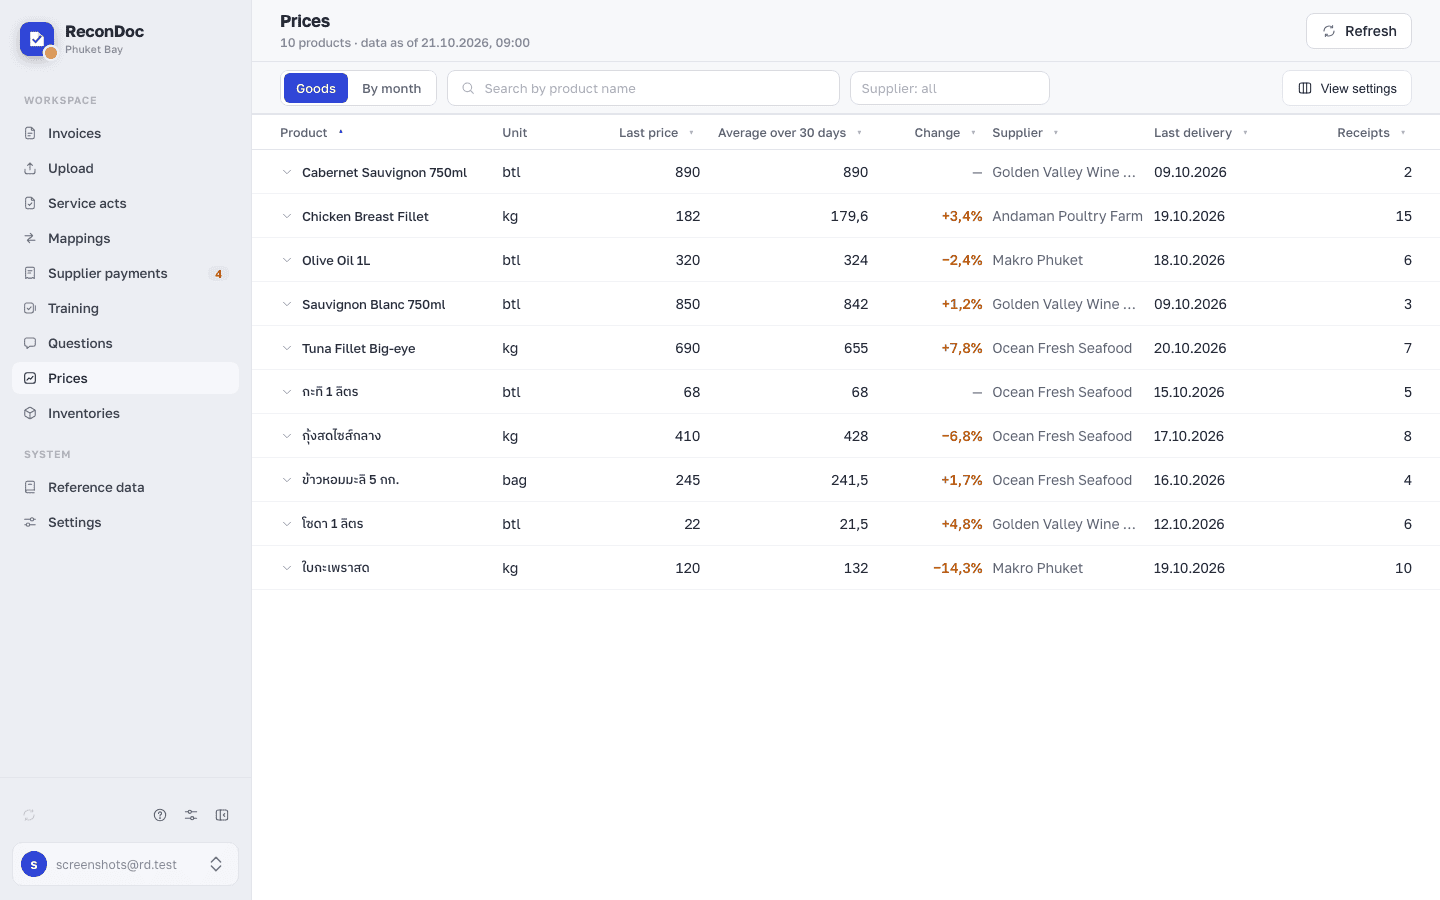 12345
- "Refresh" — refreshes the price history now instead of waiting for the scheduled refresh.
- Search — by product name from the iiko catalog.
- "Supplier: all" — filter: only the products the chosen supplier has delivered.
- "Change" — the column header; clicking it sorts by price change.
- Product row — clicking it opens the price history.
| Column | What it means |
|---|---|
| Product | The name from the iiko catalog. Clicking the row opens the price history. |
| Unit | The product's base unit in iiko. |
| Last price | The price from the latest receipt, excluding VAT. |
| Average over 30 days | The purchase total over 30 days excluding VAT, divided by the quantity bought. A large purchase weighs more than a small one. |
| Change | The last price against the same supplier's previous price: "+" means it went up, "−" means it went down. A dash means there's nothing to compare or the price didn't change. |
| Supplier | Who made the latest delivery. |
| Last delivery | The date of the latest receipt. |
| Receipts | How many times the product was received over the whole collected history. |
Tip
To find what went up the most, click the "Change" header: the first click puts the biggest increase on top.
A product's price history#
Click a row — the price history opens below it.
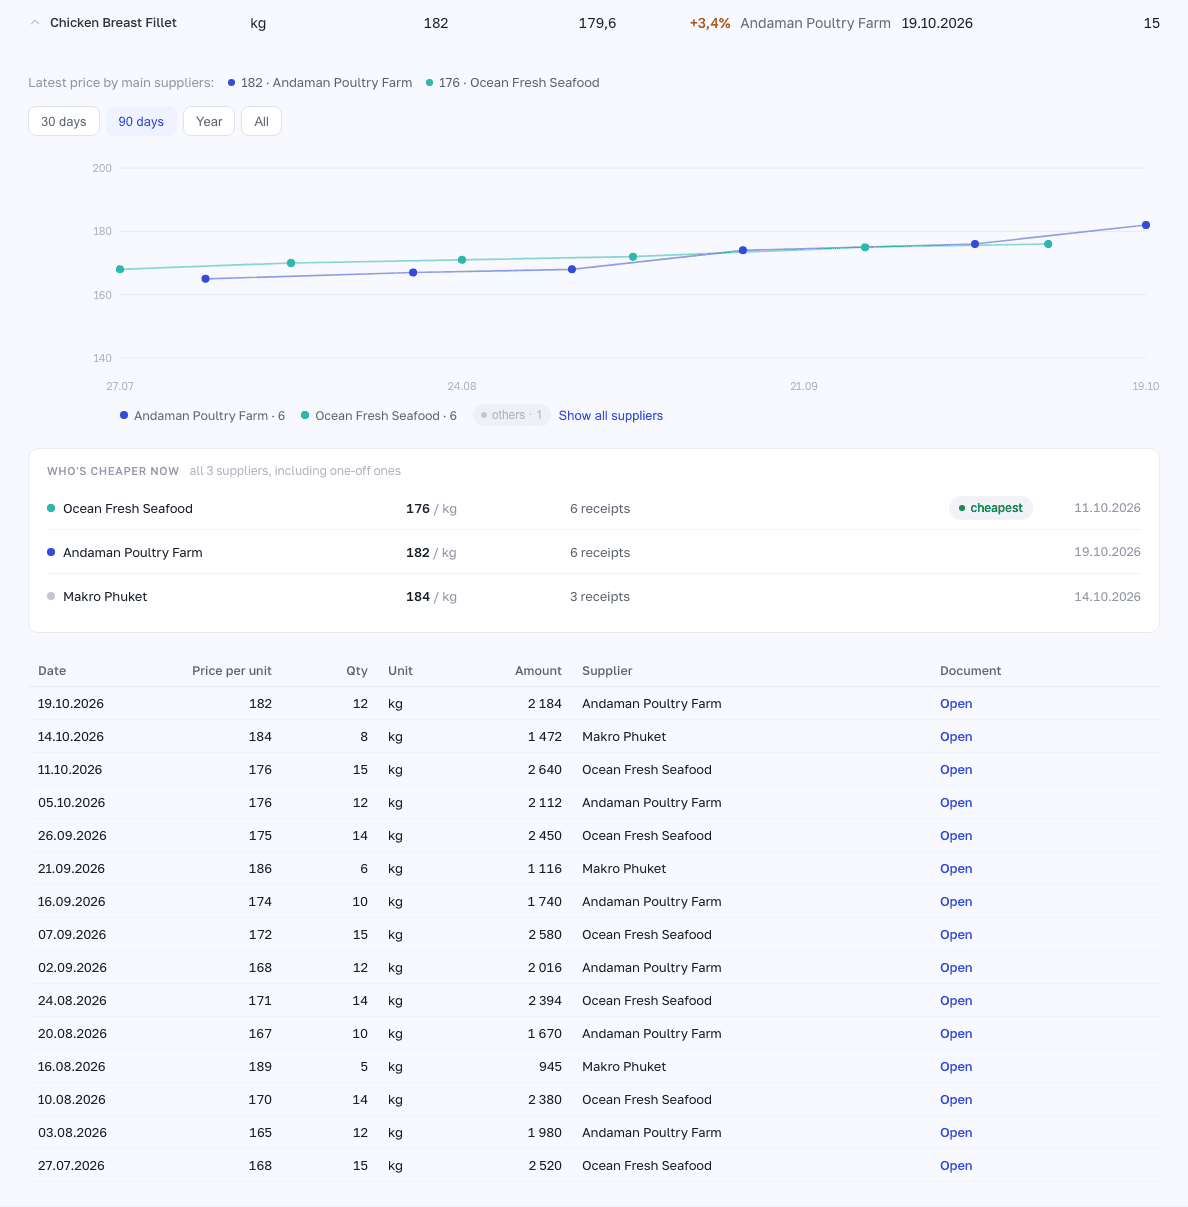 12345
- Period — the time span for the chart, the summary and the table.
- Chart — one dot per receipt; the color is the supplier.
- Legend — the main suppliers and their receipt counts; the rest are tucked behind "others".
- "Who's cheaper now" — suppliers from cheapest to most expensive by their latest price.
- Receipts table — every receipt for the period; "Open" leads to the invoice card.
Above the chart. The last price, supplier, date and change are already in the table row right above the history, so they aren't repeated here. If several regular suppliers deliver the product, a "Latest price by main suppliers" line above the chart shows the price from each.
Period. The "30 days", "90 days", "Year" and "All" chips change the period of the chart, the summary and the table. The default is 90 days.
Chart. One dot is one receipt; the color is the supplier. Up to four main suppliers — those who delivered the product at least five times — get their own color. The rest are gray and tucked behind "others · N"; the "Show all suppliers" button brings them up. Hollow dots marked "not yet sent to iiko" are ReconDoc invoices that haven't gone to iiko yet. Hover over a dot to see the price, date, quantity, supplier and document number.
"Who's cheaper now". All suppliers for the period, one-off ones included, from cheapest to most expensive by their latest price. Each shows its number of receipts and the date of the latest one. The "cheapest" tag marks the first one. The "hasn't delivered in a while" tag appears when the supplier's latest delivery was more than two weeks ago: its low price may be out of date. If the product has only one supplier, there is no such summary.
Receipts table. Date, price per unit, quantity, amount, supplier and document. A receipt that came through ReconDoc has an "Open" link: the invoice card with the photo opens in a new tab. A document entered in iiko directly shows its number. The first 20 receipts are visible; the rest are behind the "Show all" button.
From an invoice#
In the invoice card, a line matched to a product has a "Price history" link. It opens the same history for that one product in a new tab. The "All prices" button goes back to the full list.
By month#
Use the "Goods / By month" switch to change the view. "By month" opens the previous calendar month by default. Click the month button to choose another month from the list; months that are still open are marked "not closed". Your choice stays in the page URL and survives a reload.
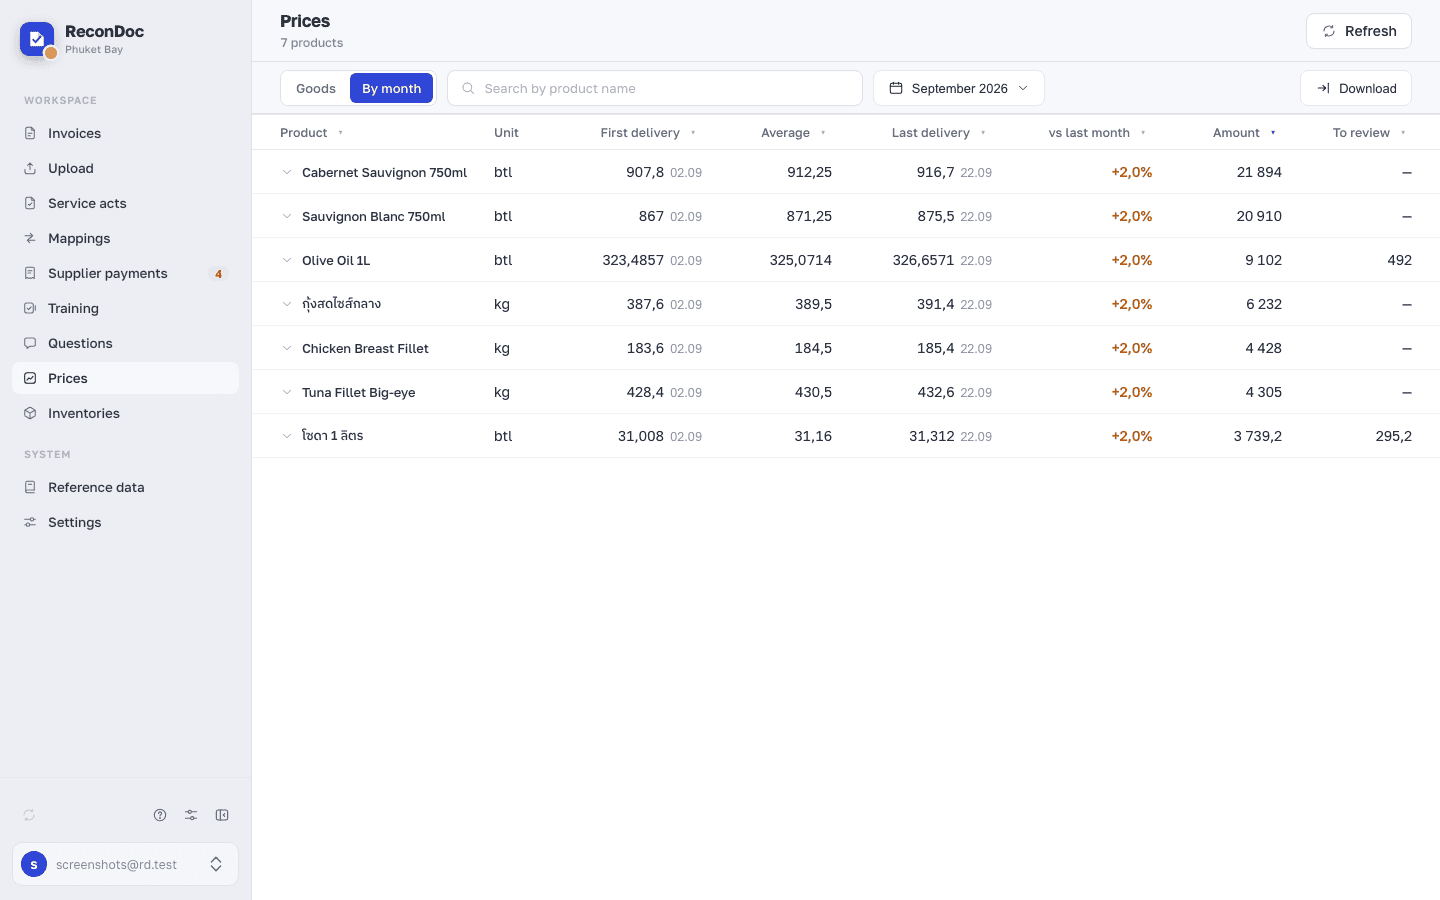 1234
- "Goods / By month" — switches between views.
- Month — selects the month for the table.
- "Download" — exports the selected month as a CSV for Excel.
- Product row — opens the product's price history.
The table combines each product's purchases from all suppliers during the selected month. Prices are per base unit in iiko, excluding VAT. "First delivery" and "Last delivery" show prices at the start and end of the month's delivery history, rather than prices on the first and last calendar day.
| Column | What it means |
|---|---|
| Product | The name from the iiko catalog; click the row to open its price history. |
| Unit | The product's base unit in iiko. |
| First delivery | The price on the first day with deliveries that month; the date appears to the right of the price. If there were several deliveries that day, this is their total amount excluding VAT divided by their total quantity. |
| Average | The month's purchase total excluding VAT divided by the quantity bought. A large purchase carries more weight than a small one. |
| Last delivery | The price on the last day with deliveries that month; the date appears to the right of the price. Multiple deliveries that day are weighted by quantity, just as for First delivery. |
| vs last month | The percentage change from last month's average to this month's average. "+" means an increase; "−" means a decrease. A dash means there is no comparison available or the average barely changed. |
| Amount | The total spent on the product that month, excluding VAT. |
| To review | How much less purchases from the other suppliers would have cost at the cheapest supplier's average price for the same month. A dash means fewer than two known suppliers; zero means their average prices were equal. |
Hover over the first or last price: if there were multiple deliveries that day, the tooltip shows how many and explains that the price is their average. Products with the highest "Amount" appear first by default. Click a column header to change the sort order, or search by product name.
"To review": an example. Ocean Fresh Seafood's average price for Olive Oil 1L that month was 307.5 per bottle. You bought 16 bottles from Golden Valley Wine & Spirits for 5,412. At the first supplier's average price, those bottles would have cost 16 × 307.5 = 4,920. "To review" shows 5,412 − 4,920 = 492. Hover over the amount to see the cheapest supplier and their average price, so you can check the calculation.
Treat this as a reason to look at the purchases, not a verdict on your buyer's performance. The cheaper supplier may have offered a different quantity, quality or pack size, or different delivery terms. The amount is a comparison with their average price, not a guaranteed saving.
"month not closed, data may change until DD.MM". Each refresh rereads the last 14 days of deliveries. Data can therefore still be added after a month ends: September stays open through 14 October and is considered closed from 15 October. The date in the subtitle marks the end of that window.
Opening a row. You get the same price history as in "Goods": the chart, supplier summary and receipts table. The initial period is chosen to include the selected month: "90 days", or "Year" or "All" for older months. You can change it using the chips above the chart.
"Download". Saves the selected month as a CSV for Excel. The filename is ceny-YYYY-MM.csv, or ceny-YYYY-MM-ne-zakryt.csv for a month that is still open. The export includes all rows matching your search, in the current sort order, including rows still behind "Show more". Fields are separated by semicolons, numbers use a decimal comma, and dates use YYYY-MM-DD.
The CSV includes every table column plus extra detail. The headers, in order, are: "Product", "Unit", "First delivery, date", "First delivery, price", "Average", "Last delivery, date", "Last delivery, price", "Last month's average", "vs last month, %", "Quantity", "Amount", "Receipts", "Suppliers", "To review", "Cheapest supplier", "Cheapest supplier's average", "Currency". Currency comes from the restaurant settings; headers use the interface language.
Who sees the section#
Everyone who has access to reference data sees the section, including the Observer. "By month" uses the same permissions, and Observers can download the CSV too. The "Refresh" button is visible to those who can edit reference data.
What you do here
What's next
Didn't find the answer, or the guide didn't help?
Ask support